


Chapter 1: EVs and their need
1.1 Introduction
Major concerns in today’s world are the soaring prices of oil, rapid depletion of conventional energy resources and increased carbon emission resulting in Greenhouse effect. This motivates the use of Electric vehicles in transportation system. In the present scenario, thermal based power plants meet 70% of the India’s total energy demand. The projected growth of EVs will result in greater electricity demand and this will then have to be met with a sustainable integration of both conventional as well as non-conventional energy resources. In future, due to growth of EVs, using conventional energy resources for electricity generation is not favorable because of lower well to wheel efficiency and higher CO2 emissions. For healthier environment, percentage of energy produced by coal should be substantially decreased and more stress should be placed on the abundant renewable energy resources such as solar, wind, rain, tides and geothermal heat. This would help in a cleaner environment and an energy efficient society.
A comparison of carbon emission among different types of vehicles such as, ICE vehicles, Hybrid, PHEVs and EVs, is important to further determine whether the use of EVs is beneficial in terms of CO2 emission. It has been estimated that by 2020, 0.3 million EVs will ply on Indian roads. Thus, in future EVs will play a very important role in transportation system and therefore, the study of their impact on the environment is essential.
In this chapter we will investigate the current scenario and future scenarios of electricity sector in India followed by the CO2 emissions due to different energy resources. This chapter also explains how EVs and PHEVs are better suited for transportation as compared to ICE vehicles based on their CO2 emission. Under the new electricity scenarios presented by the Planning Commission of India, where renewable energy resources are more exploited to its potential, EVs and PHEVs will help in reducing the CO2 emission for sustainable development and greener planet.
1.2 Electricity sector in India
India is world's 6th largest energy consumer, accounting for 3.5% of global energy consumption and 5th largest energy producer. India’s annual energy production increased from about 190 billion kWh in 1986 to more than 680 billion kWh in 2006. The demand for energy, particularly commercial energy, has been growing rapidly due to India’s growing economy and socio-economic development. Energy demand has grown at an average of 3.6% per annum over the past 30 years.In July 2010, the installed power generation capacity of India stood at 162,366 MW while the per capita energy consumption stood at 612 kWh. The total demand for electricity in India is expected to cross 950 GW by 2030 under an 8% GDP (Gross Domestic Product) while a higher standard of living and 9% GDP will require 1207 GW. Presently, about 70% of the electricity consumed in India is generated by thermal power plant, 24.8% by hydroelectric power plant, 10.2% by natural gas power plant, 1.6% by wind power plant and 3% by nuclear power plant. More than 50% of India's commercial energy demand is met through the country's vast coal reserves.Current installed base of Renewable energy is 16492.42 MW. It is estimated that by 2020 solar power will cross 20 GW.
In order to eliminate the shortage of energy supply and sustain the projected 9% economic growth in the Eleventh Plan period, India has to enhance the availability of commercial energy resources to meet its human development goals. For a sustained growth rate of 8% through 2031-32 and to meet the energy needs of all citizens and booming economy, India needs, at the very least, to increase its primary energy supply and harness renewable energy resources more to become an energy independent nation. Coal is and will remain the dominant power resource but for a cleaner energy mix India need’s to diversify energy resources, and hence renewable remain important to India’s energy sector. Solar power could be an important player in India attaining energy independence in the long run.
In 2009-10, India had seven major sources of electricity generation. Table 1.1 shows the percentage generating capacityof various resources along with their transmission and distribution efficiency. Overall generation efficiency is important to correctly judge a country's development in electricity sector. The generation efficiency is calculated as:
 |
(1.1) |
Table 1.1: Role of different energy resources in electricity generation and their efficiencies – India (2009-10).
| Electricity generation technology | Percentage of generation capacity | Generation efficiency | Transmission and distribution efficiency |
| Crude oil | 0.9% | 23% | 74% |
| Natural Gas | 10.2% | 23% | 74% |
| Coal | 53.4% | 23% | 74% |
| Hydro | 24.8% | 87% | 74% |
| Nuclear | 3.1% | 35% | 74% |
| Solar | 0.4% | 12% | 74% |
| Wind | 1.6% | 38% | 74% |
| Non commercial | 5.6% | 35% | 74% |
 |
(1.2) |
 |
(1.3) |
If for instance, India's output production is assumed to be 100 MW, then, coal based power plants generate about 53.4 MW. Considering its generation efficiency of 23%, 53.4 × 100 / 23 = 232.17 MW of input power is required. Similarly, for other generation technology, the input power is calculated and then summed to be 341.45 MW. The overall electricity generation efficiency is
 |
(1.4) |
Thus, after transmission and distribution losses in India, the overall electricity generation efficiency, i.e. efficiency from power plant to end consumer, is 22%. Such lower efficiency results in higher carbon emission and affects the efficiency of EVs.
1.3 Carbon Emission
In developing countries like India, air pollution increases due to rapid economic developments, increasing traffic, growing cities and higher levels of energy consumption. ICE vehicles and power grids are the major source of carbon emission. Carbon monoxide (CO) and hydrocarbons (HC) account for 64% and 23% respectively, of the total emission load due to vehicles. Coal based thermal power stations, a significant producer of electricity presently and in future as well, delivers high amount of CO2 in the atmosphere. This emission contributes to the greenhouse effect and due to low quality of coal in India, these emissions increases drastically. Coal production in the terminal year (2012) of Eleventh Plan period was projected to rise by almost one and half times the production level in 2006-07. Therefore, India must seek alternative and cleaner coal combustion technologies as well as lay more stress on the research and development of innovative energy extraction procedures from renewable resources. Moreover, the environmental impact of various energy options is of growing concern. Hence, it has to be seen that the demand is met through an environment-friendly and sustainable manner. In 2009-10, CO2 emission due to various generation technologies in India is calculated as:
 |
(1.5) |
For e.g. in coal based generation technology, 1000 grams of CO2 is released in the atmosphere per kWh. Since, percentage of energy generating through coal based power plants in India is 53.4%, 534.0 grams of CO2 is released per kWh. Similarly for rest of the technologies, India’s corresponding share in CO2 emission is calculated and shown in Table 1.2. On an average, kilowatt-hour energy results in the contribution of about 599 grams of CO2 to the environment. As shown in previous section, an overall generation, transmission and distribution efficiency of 22% results in higher CO2 emission by different generation technologies.
Keeping in view the rise in energy demand by 2030 and rapid population growth, the Planning Commission of India proposed eleven different scenarios. In these scenarios, the ratio of different energy resources were altered to assess the critical policy options for meeting the demand of 962 GW (at 8% GDP) of energy by 2030. It is mentioned that even the least intensive coal option would require the domestic coal production to increase to 1580 Mt.
Table 1.2: Role of different energy resources in CO2 emission – India (2009-10).
| Electricity generation technology | Grams of CO2 per kWh | Percentage of generation capacity | Contribution in CO2 emission (g/kWh) |
| Coal | 1000 | 53.4% | 534.00 |
| Oil | 650 | 0.9% | 5.85 |
| Natural gas | 500 | 10.2% | 51.00 |
| Solar | 150 | 0.4% | 0.60 |
| Wind | 23 | 1.6% | 0.37 |
| Hydro | 5 | 24.8% | 1.24 |
| Nuclear | 5 | 3.1% | 0.15 |
| Others | 100 | 5.6% | 5.60 |
| Total | 100.0% | 598.81 |
Estimation of CO2 generated for various scenarios proposed by the Planning Commission of India are calculated and tabulated below (Table 1.3). Intensive coal based scenario 1 provides the maximum emission at 695 g/kWh while forced renewable (scenario 11) lowers the emission down to 467 g/kWh. It is seen that the difference of CO2 emission between these extreme scenarios is nearly 33% (Table 1. 3). Thus, it can be seen from figure 1.1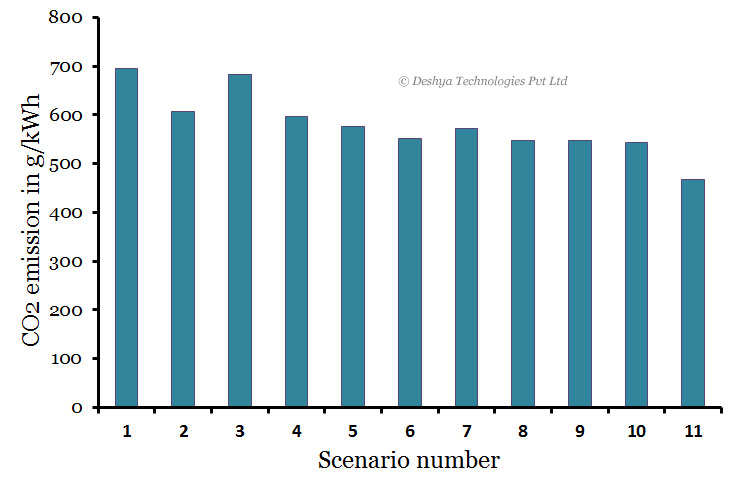
Figure 1. 1: CO2 emission from power generation for proposed scenarios in 2031-32 - India. that a better mix of renewable energy source with conventional ones proves beneficial for cleaner environment.
Table 1.3: of different energy source in total energy of India by 2031-32 (8% GDP growth) and CO2 emission.
| % are in respect to total MW by 2031 - 32 | ||||||||
| Proposed Scenerio No. | Oil(%) | Gas(%) | Coal(%) | Hydro(%) | Nuclear(%) | Renewable(Solar & Wind)(%) | Non-Comercial(%) | Total Co2 |
| 1 | 23.93 | 5.12 | 50.32 | 7.19 | 4.01 | 0.32 | 9.11 | 694.29 |
| 2 | 21.95 | 4.75 | 43.14 | 17.79 | 3.69 | 0.29 | 8.37 | 607.60 |
| 3 | 23.93 | 5.12 | 49.15 | 7.19 | 5.18 | 0.32 | 9.11 | 682.67 |
| 4 | 21.96 | 4.75 | 42.06 | 17.79 | 4.76 | 0.29 | 8.38 | 596.90 |
| 5 | 22.01 | 8.92 | 37.82 | 17.80 | 4.76 | 0.29 | 8.38 | 575.72 |
| 6 | 23.54 | 8.43 | 34.63 | 19.03 | 5.09 | 0.31 | 8.96 | 551.90 |
| 7 | 22.21 | 8.75 | 37.46 | 17.99 | 4.81 | 0.30 | 8.47 | 572.59 |
| 8 | 23.37 | 8.37 | 34.16 | 19.23 | 5.14 | 0.32 | 9.05 | 548.20 |
| 9 | 22.25 | 8.51 | 34.90 | 19.56 | 5.23 | 0.23 | 9.21 | 546.95 |
| 10 | 18.72 | 8.87 | 36.66 | 20.37 | 5.45 | 0.34 | 9.59 | 543.77 |
| 11 | 16.68 | 7.15 | 30.12 | 18.73 | 5.01 | 13.50 | 8.82 | 467.03 |
| Source: Planning Commission report on Integrated Energy Policy: | ||||||||
| % different between extreme scenarios (scenerio I and scenerio II) = (694.29 - 467.03)/694.29 × 100 = 33% | ||||||||
Figure 1.1: CO2 emission from power generation for proposed scenarios in 2031-32 - India.
1.4 Carbon Emission by vehicles
Apart from the thermal based power generating stations, ICE vehicles also contribute significantly to carbon emission. Worldwide, combustion of fuel in vehicles amounts to about 18% of CO2emission(ENERCEE 2009). According to U.S. Environmental Protection Agency survey, the annual CO2 emissions from vehicles using DOT fuel economy numbers(USEPA) are as follows:
- Passenger Car = 4.78 metric tons CO2
- Light Truck = 6.00 metric tons CO2
- All passenger vehicle = 5.23 metric tons CO2
On an average the CO2 emission range for Internal Combustion Engine vehicle is 167 to 224 g/km. In 2008-2009, the annual production of passenger vehicles in India was 1,838,593. Assuming the lowest CO2 emission i.e. 167 g/km, in that year 1,838,593 × 167 = 307,045,031 g/km more of CO2 was released in the atmosphere. This amounts to a significantly high carbon emission considering the future growth trends in annual production of passenger vehicles in India. Figure 1.2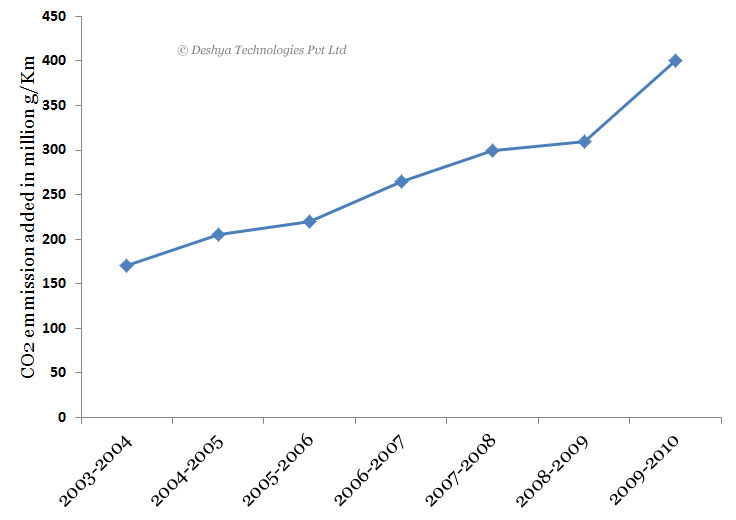
Figure 1.2: CO2 emission for the annual passenger vehicle production trends in India. shows the growth of extra CO2 emission added annually according to SIAM annual passenger vehicle production trend from 2003-04 to 2009-10. It clearly shows the impact of vehicle pollution on atmosphere and future trends.
Figure 1.2: CO2 emission for the annual passenger vehicle production trends in India.
A modern electric car requires 0.2 to 0.3 kWh/km. In India, there is about 26% electrical power losses between the generating plant and the charging station of the car. These losses decrease well to wheel efficiency more abruptly.
Table 1.4 explains the efficiency of different type of vehicles presently on road in India. Since Well-to-tank efficiency of EV and PHEV depends on electricity scenario, 2009-10 is assumed as a reference for the overall generation efficiency of 22% (Table 1.1). The well-to-wheel efficiency is calculated as:
 |
(1.6) |
For e.g. well-to-wheel efficiency of EV is 22% × 72% = 15.8%. In calculation of Well-to-Tank efficiency of PHEVs, it is assumed that half of the time it is functioning as EV and the rest as HEV (diesel). Therefore, it is safe to consider its efficiency to be the average of EV and HEV.
 |
(1.7) |
Therefore, the Well to Tank efficiency of PHEV is 52.5%. Similarly, the rest of the data is calculated for other vehicles. Midsize vehicle class is considered for all cases and all the figures are computed in ideal conditions.
Table 1.4: Efficiencies of different type of vehicles.
| Type of vehicle | Well to tank efficiency | Tank to wheel efficiency | Well to wheel efficiency |
| Petrol | 83.0% | 18% | 15.0% |
| Diesel | 83.0% | 22% | 18.0% |
| CNG | 83.0% | 18% | 15.0% |
| HEV (petrol) | 83.0% | 30% | 25.0% |
| HEV (diesel) | 83.0% | 30% | 25.0% |
| PHEV | 52.5% | 45% | 23.6% |
| EV | 22.0% | 72% | 15.8% |
It is more appropriate to compute CO2 emissions in order to compare EVs with ICE vehicles incorporating power plant, oil drilling and oil refinery emission along with vehicular pollution. Table 1.5 presents the CO2 emission by various types of vehicle in India. For ICE vehicles and HEVs, in addition to tail pipe emission, oil refinery and transportation is also considered to compare the overall carbon emission. It is also assumed that the CO2 emission from well-to-wheel (g/kWh) is same as from the tail pipe of the vehicle (g/kWh).
Overall CO2 emission (g/km) for ICE vehicles and HEVs is calculated as:
 |
(1.8) |
For e.g. in petrol vehicle, tail to pipe CO2 emission is 193 g/km but considering Well-to-Tank efficiency of petrol;
 |
(1.9) |
For EV, energy from Tank to Wheel is 0.20 kWh/km, but when transmission and distribution losses (26% in 2009-10) are included;
 |
(1.10) |
 |
(1.11) |
The tail pipe emission is zero but accounting the emission from primary energy source,
 |
(1.12) |
 |
(1.13) |
Due to reason mentioned above, it may be assumed that the CO2 emission for PHEV is the average of EV and HEV (diesel).
If 2008-2009 annual production trend in passenger vehicles is observed in future for EVs, keeping the present scenario of electricity generation in India unchanged, no major change in CO2 emission will be seen. Hence, electricity generation from renewable energy resources should be exploited more to cut back the carbon emission. The Planning Commission of India proposed eleven different scenarios for 2031-32 to mitigate the problem of energy consumption. The following section details the CO2 emission of EV and PHEV in those scenarios.
Table 1.5: CO2 emission by various types of vehicles in India (2009-10).
| Type of vehicle | Energy from tank to wheel (kWh/km) | Energy from well to wheel (kWh/km) | CO2 emissions in g/km (tail pipe) | CO2 emission in g/km |
| Petrol | 0.75 | 0.877 | 193.0 | 225.7 |
| Diesel | 0.55 | 0.645 | 146.0 | 171.2 |
| CNG | 0.75 | 0.877 | 148.0 | 173.1 |
| HEV (petrol) | 0.47 | 0.550 | 123.0 | 143.9 |
| HEV (diesel) | 0.33 | 0.386 | 89.4 | 104.7 |
| PHEV | 0.26 | 0.325 | 44.7 | 127.8 |
| EV | 0.20 | 0.250 | 0 | 150.9 |
1.5 Future scenarios for electricity generation in 2031-32
Renewable energy resources are clean sources of energy. In the new proposed scenario, percentage of total energy supplied by renewable resources should be increased. Harnessing of tidal energy, solar energy, water and biomass should be higher than the thermal energy, which can reduce the consumption of fossil fuels and in turn reduce air pollution. If demands of future Electric vehicle are met by clean sources of energy, there will be a drastic change in carbon emission and other climatic effects.
India is blessed with an abundance of sunlight (Thar Desert), water, large offshore area (wind) and biomass. Contribution of small hydro power plants in rural areas, base power stations on rivers, solar panels, offshore and onshore wind power stations and nuclear energy should be increased. As in July 2009, India unveiled a US$ 19 billion plan, to produce 20 GW of solar power by 2020.
To meet the energy demands in future, the Planning Commission of India proposed eleven different scenarios in their Integrated Energy policy report (Table 1.6). If these scenarios are actively adopted then the carbon emission of EVs and PHEVs are calculated to see their impact on environment.
Table 1.6: CO2 emission of EV and PHEV in proposed scenarios.
| Scenario | EV CO2 emission ib gm/km | PHEV CO2 emission in gm/Km |
| 1 | 180.56 | 145.60 |
| 2 | 157.98 | 131.33 |
| 3 | 177.49 | 141.09 |
| 4 | 155.19 | 129.94 |
| 5 | 149.69 | 127.19 |
| 6 | 143.49 | 124.09 |
| 7 | 148.87 | 126.78 |
| 8 | 142.53 | 123.61 |
| 9 | 142.21 | 123.45 |
| 10 | 141.38 | 123.03 |
| 11 | 121.43 | 113.06 |
As explained in earlier section, driving an electric vehicle with an energy requirement of 0.2k Wh/km in scenario no.11, 0.2× 1.26 × 467 = 121.43 grams of CO2/km is emitted. By the same methodology, a PHEV in the same scenario results in 113 g/km of CO2 emission.
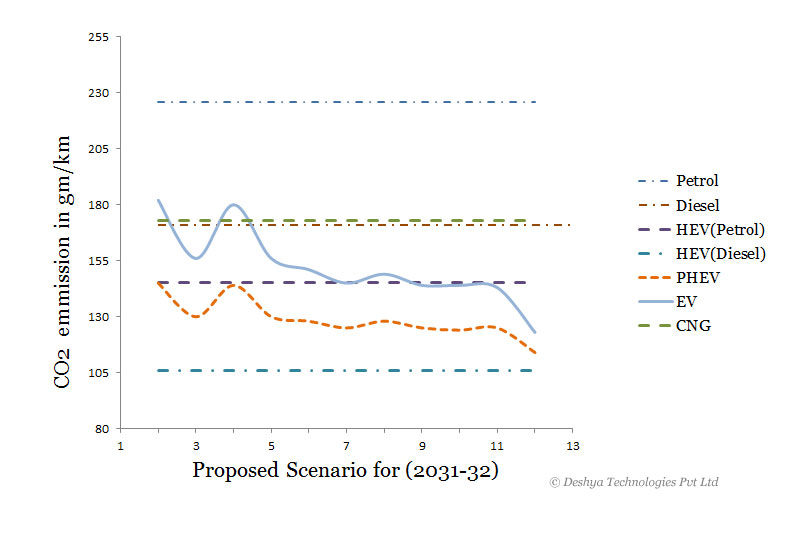
Figure 1.3: CO2 emission of vehicles for the proposed scenarios in 2031-32 – India.
An ICE vehicle emits 167 to 224 g of CO2/km whereas, from Table 1.6, EV emits 120 g of CO2/km in scenario no. 11 to 180 g of CO2/km in scenario no. 1. As is evident above, EV emissions vary from scenario to scenario while ICE vehicle emission remains fairly the same. Hence, it is found that in majority of cases EVs may not help in reducing CO2 emission. It can be predicted from figure 1.3
Figure 1.3: CO2 emission of vehicles for the proposed scenarios in 2031-32 – India. that if higher percentage of renewable energy resources is employed along with increased efficiency of EV battery and EV technology, then, CO2 emission would reduce significantly.
1.6 Conclusion
The chapter presented a comparison in carbon emission due to EVs in present scenario as well as in the new proposed future scenarios for electricity generation in India. The result was compared with ICE vehicles and was observed that EVs along with the increased harnessing of renewable energy resources will bring down the CO2 emission. The work also illustrated that by simply switching to EVs would not help save the planet from global warming (figure 1.3
Figure 1. 3: CO2 emission of vehicles for the proposed scenarios in 2031-32 – India.). Meanwhile HEVs and PHEVs can play a major role in transportation (figure 1.3
Figure 1.3: CO2 emission of vehicles for the proposed scenarios in 2031-32 – India.) until EV technology is further improved or renewable energy resources are more harnessed.
In this chapter, it is articulated that if the efficiency of electrical grid is further improved (transmission and distribution losses are reduced) and a higher proportion of wind power, tidal power and possibly more nuclear power is exploited, the advantage of EVs will improve further. Government policies regarding renewable energy resources will play a vital role in deciding the future of our planet.